No collection method is universally the most reliable. Match the method to the question, population, measurement and practical constraints.


No collection method is universally the most reliable. Match the method to the question, population, measurement and practical constraints.
A useful data process connects a decision to reliable evidence and a clear action; a dashboard alone does not improve outcomes.
Organize data import, validation, analysis and reporting in a script so another person can understand what you did and repeat it.

Use a scatterplot and a suitable correlation method to describe an association, while recognizing that correlation does not prove causation.
A regression model describes an association under its assumptions; a fitted line alone does not establish causation or guarantee useful predictions.
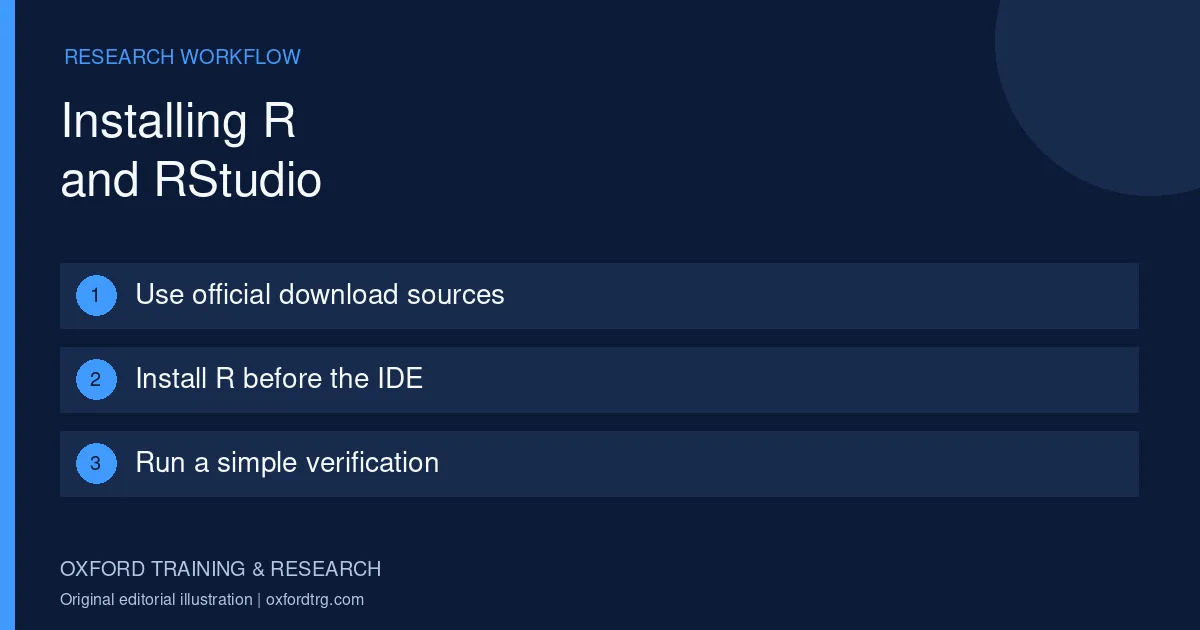
R is the statistical computing environment; RStudio is an interface for working with it. Install R first, then a compatible RStudio Desktop build.
Use one-way ANOVA to compare group means when the design and model assumptions fit your data, then interpret the result with diagnostics and context.